
Chart Analysis Features
WaveNodes Professional combines zone structure, Fibonacci reference levels, caution labels and market statistics in one TradingView indicator. It is a software tool, not investment advice.
What each module shows on the chart
Each module adds a layer of information to the chart. Labels and alerts are confirmed on bar close, so historical and live signals match.
Dynamic Support & Resistance Zones
- Market-state context
- Close-confirmed breakouts
- Zone structure review
Fib Projection System
- Fibonacci reference levels
- Imbalanced-state review
- Breakout structure labels
Trap Alert System
- Momentum-exhaustion context
- Caution labels
- Bar-close alerts
Dynamic Risk Zone
- Volatility reference
- Trend review
- Visual context
Analytics Dashboard
- Market-state summary
- Volatility reading
- Historical statistics

Dynamic Support & Resistance Zones
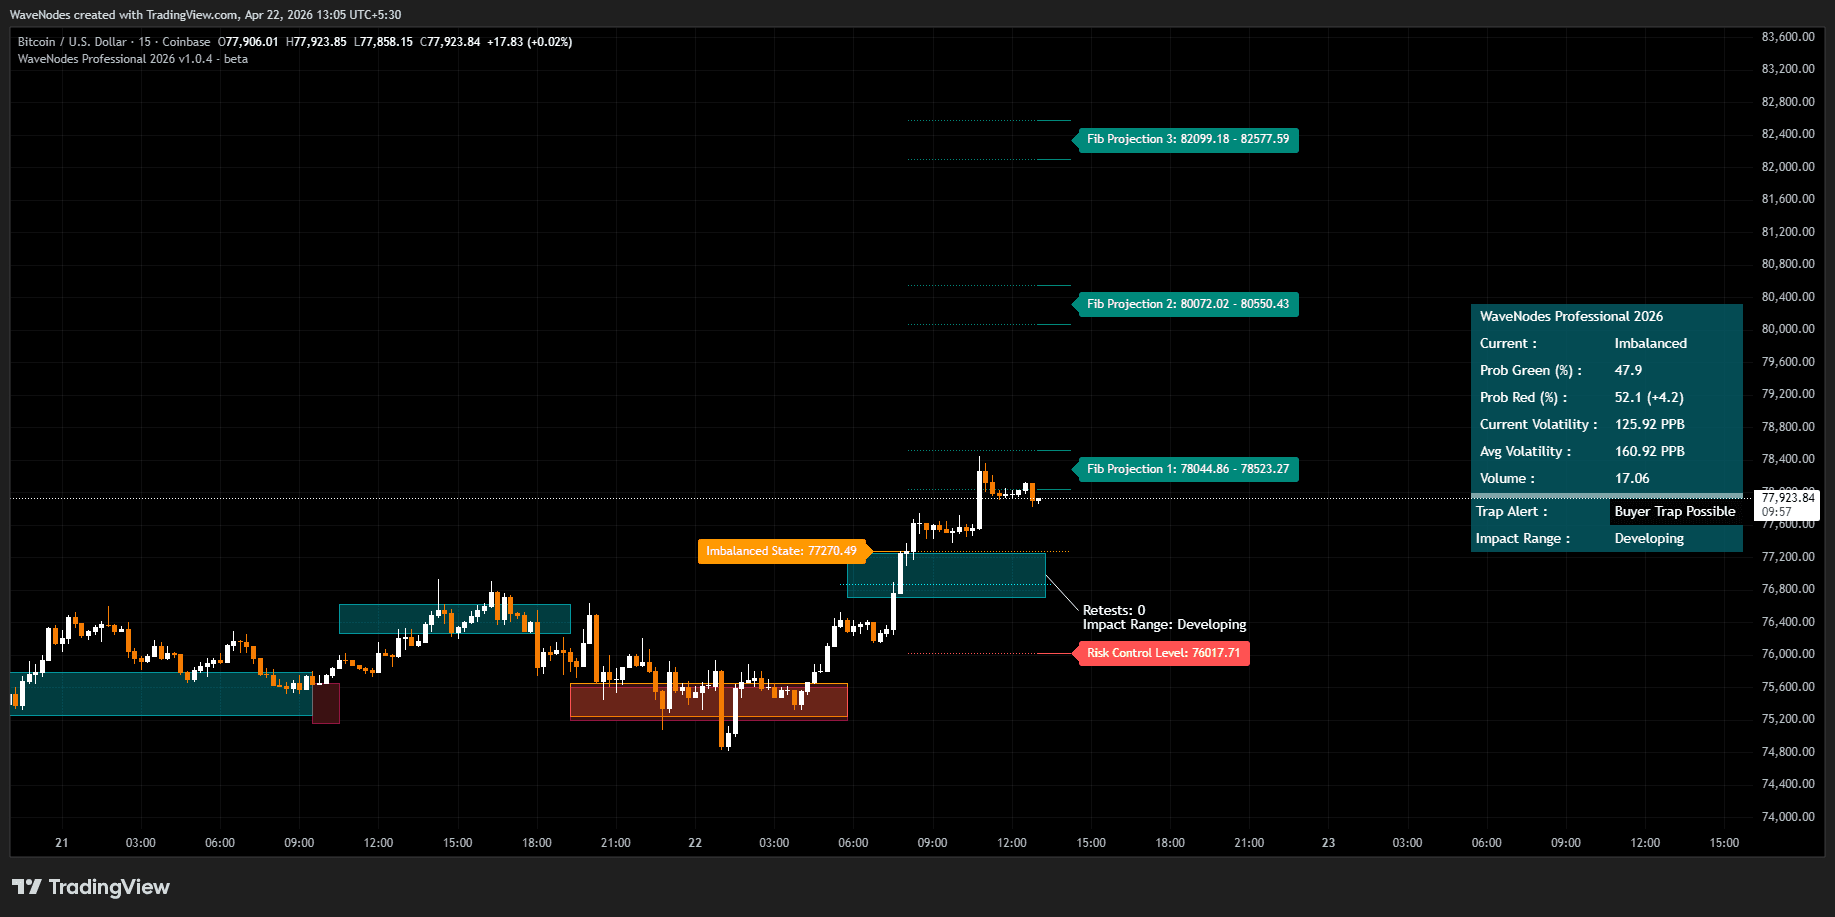
Plots adaptive bullish and bearish zones and shows whether price is inside them (Balanced) or has closed beyond them (Imbalanced).

Fib Projection System
After a close-confirmed breakout, draws Fibonacci extension bands and the 61.8% retracement of the breakout move as reference levels. Weak breakout structures are labelled separately.

Trap Alert System
Reports Buyer or Seller Trap Possible when momentum behind a sustained move is fading. It highlights risk, not direction.

Dynamic Risk Zone
Draws a volatility-based reference band around price as a visual reference. It does not place or manage orders.
Analytics Dashboard
Summarises market state, historical green/red candle ratios, volatility in points per bar, trap status and impact range from the chart's own price history.
Where it can be used
The indicator applies the same calculations to any supported TradingView chart. It does not select instruments, timeframes, entries or exits.
Workflow
Stock Market Structure
Zone structure, Fibonacci reference levels and volatility statistics on stock and index charts.
Workflow
Intraday Trading
Close-confirmed labels and alerts on intraday timeframes, with the same behaviour on historical and live bars.
Workflow
Swing & Positional
Zone structure and market-state context on daily and higher timeframes.
Review the modules, then compare the plan
Compare plans and access options. WaveNodes is a software tool and does not provide investment advice or research services.